




Expanding on the May 2026 diagnostic, this ten‑part series probes Pakistan’s energy fragility through structural and technical lenses. Part I examined the tariff spiral; Part II addresses grid modernisation — wiring the system so that paid‑for generation can reach consumers and industries.
Special Series: Reclaiming Sovereignty – Part II
The Innkeeper’s Next Problem
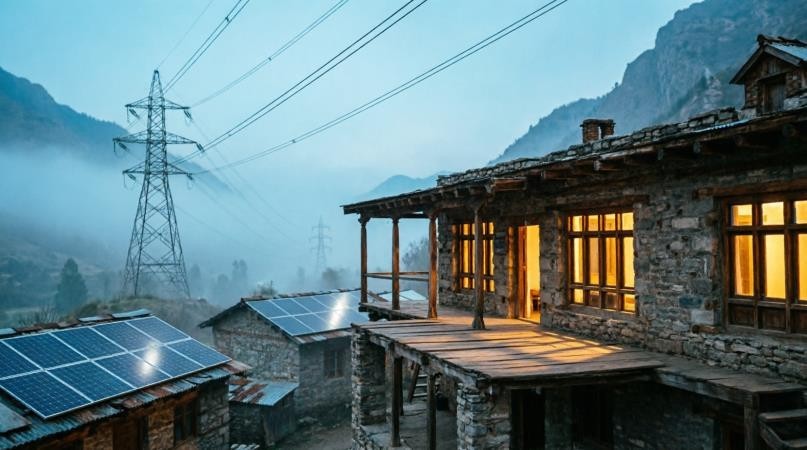
The Inn had a great summer season. Tourists escaping the hotter plains had filled the rooms, enjoying the natural cool. Now the summer has drifted into fall, a non-peak tourism period. However, our innkeeper in the hills needs a plan for the peak winter season when the snow comes. To fill the empty rooms and keep the tourists warm and comfortable, heating would be required. His electrician warns him that before you invite guests to plug in their heaters, you must check the wiring. If the cables are frayed, the fuse box overloaded, half the sockets dead – the rooms will remain useless, no matter how beautiful the view.
Pakistan’s energy system is that inn. It owns 46,600 MW of generation – more than enough to light every home and power every factory. Yet last year the grid could not evacuate more than 30,000 MW at peak demand. A third of the capacity we have already paid for is stranded behind transmission bottlenecks. Another 17.55 per cent of what is generated simply disappears – stolen, leaked, or lost in aging wires before a single rupee is collected.
The arithmetic is cruel but simple: every lost unit raises the per-unit burden on the paying customer. The wiring is not just a weakness; it is an amplifier of the capacity trap diagnosed in Part I.
This paper shows how to rewire the system. It does not call for new power plants.
It calls for a 500 kV backbone, smart meters, performance-managed distribution companies, and a self-financing recovery mechanism that turns loss reduction into a source of investment capital.
The rooms would remain dark and empty until the wiring is restored. Once the current flows again, light and warmth will draw guests even in winter, filling the halls. Their presence will bring revenue that swiftly offsets the upgradation costs, turning silence into profit within a single season.
The Grid as the Missing Middle Part I established the volume solution
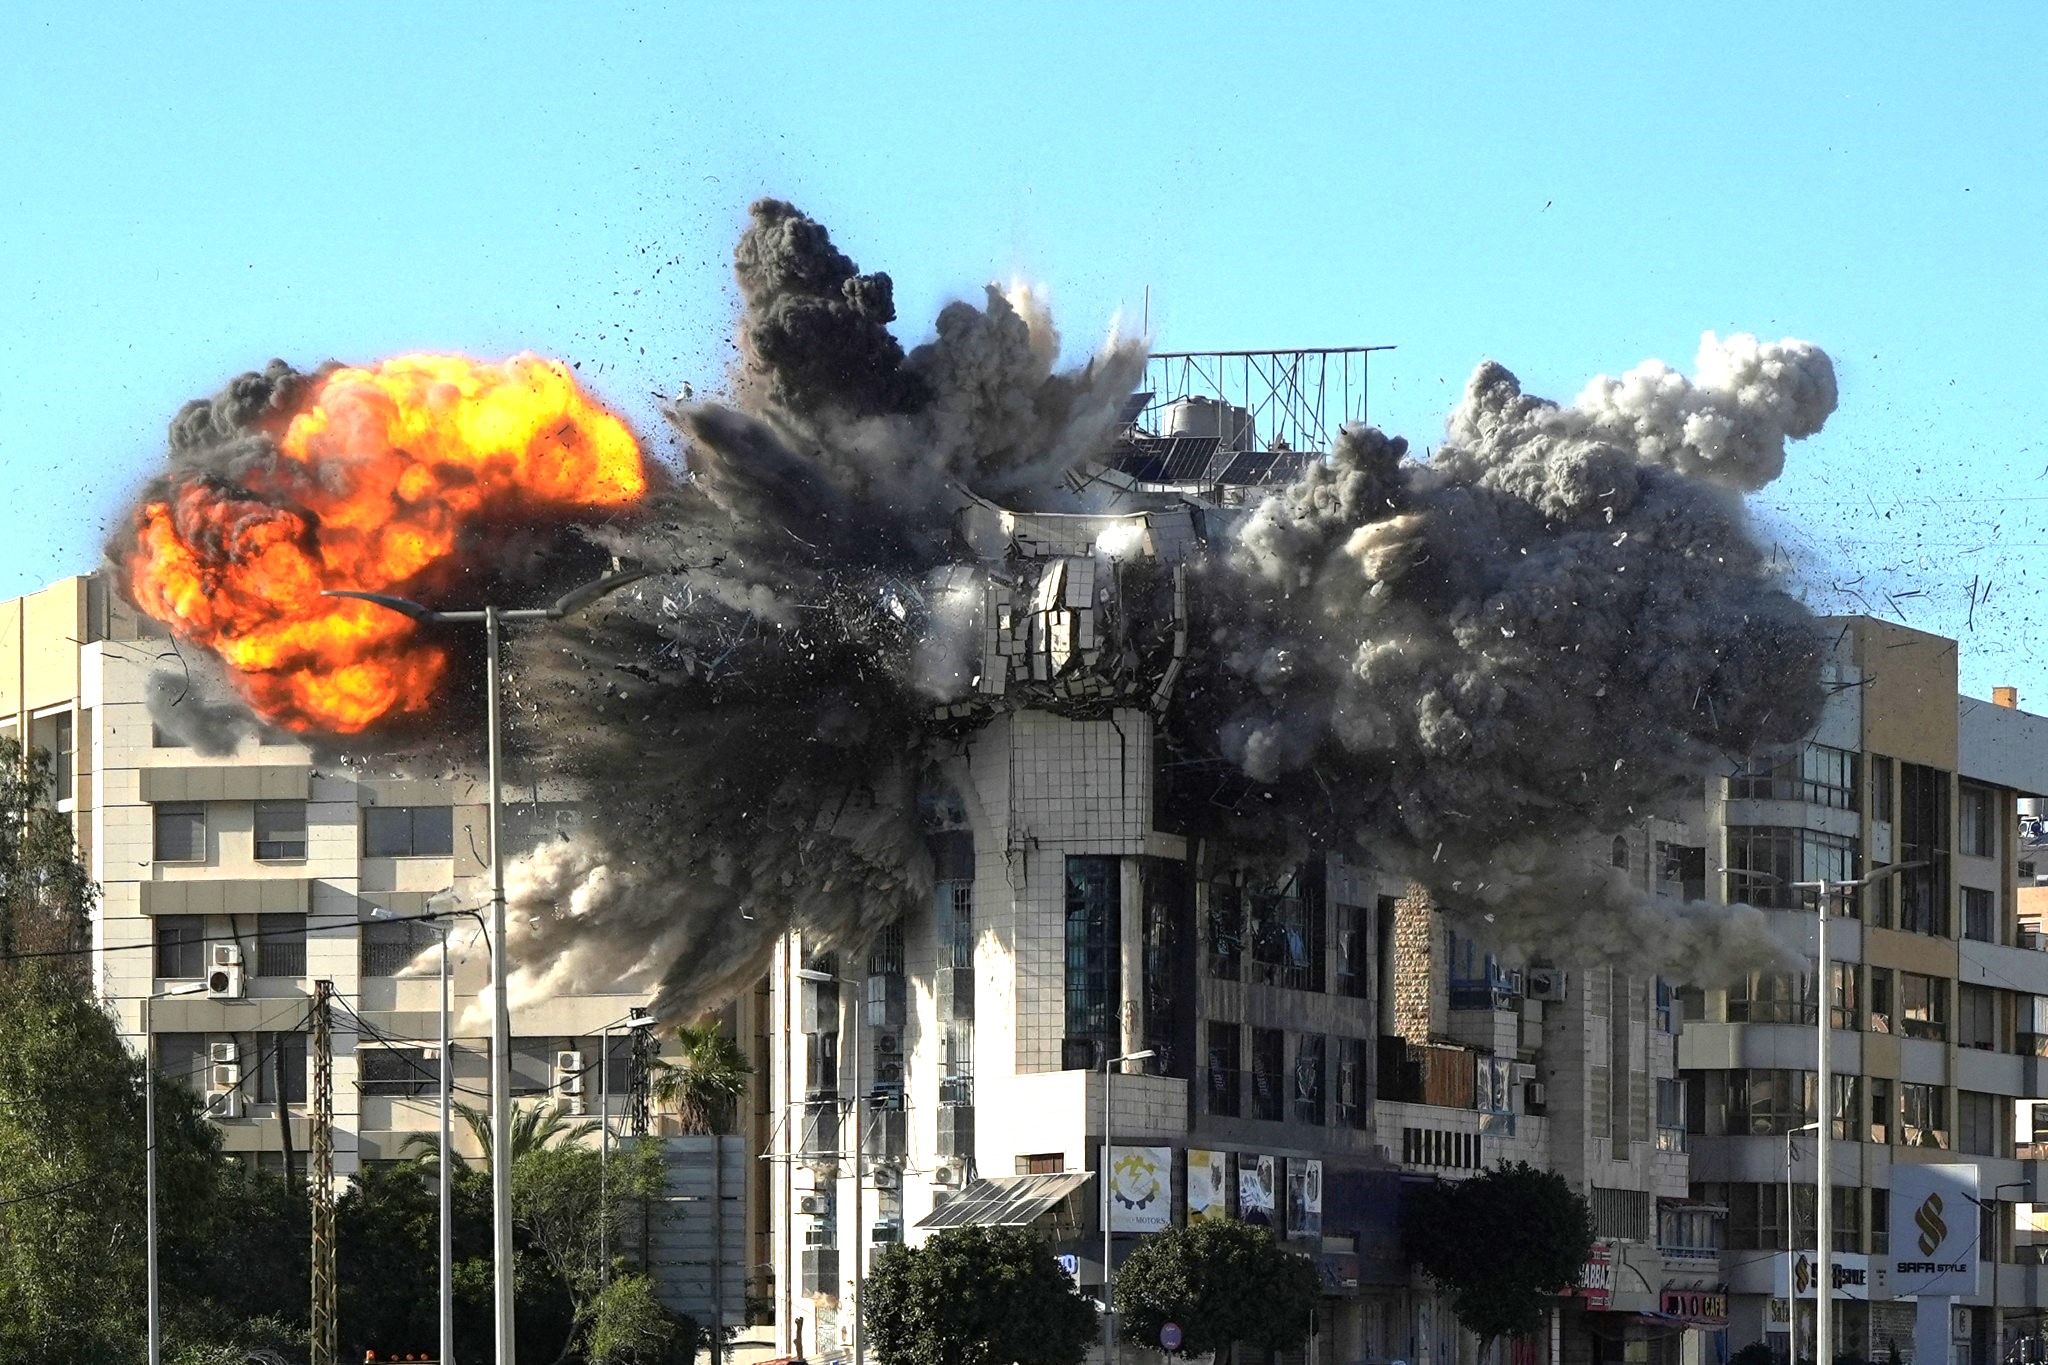
sell more electricity to dilute fixed capacity payments. But between the power station and the consumer stands a grid that punishes utilisation. Two failures define it. First, congestion. Cheap power from the Thar coal fields, the wind corridor of Thatta, and the nuclear plants near Karachi cannot reach the industrial heartland of Punjab. The 500 kV lines that were designed for a simpler era are now so clogged that the system operator must dispatch expensive imported-fuel plants in the north simply because southern electrons cannot get through. NEPRA’s technical member has noted that transmission bottlenecks alone forced Rs 69 billion in capacity payments to under-utilised coal plants in FY2025 – money spent for electricity that existed but could not be used. Second, distribution collapse. Even when power reaches a DISCO grid station, nearly one-fifth of it vanishes. In PESCO’s territory, losses exceed 37 per cent and in QESCO’s, 38 per cent. The national average of 17.55 % masks the haemorrhage, due to a few efficient DISCOs like IESCO at 8.6 % and FESCO at 9%. When poor bill recovery is added, the combined annual financial burden of DISCO inefficiency approaches Rs 397 billion, equivalent to nearly one-quarter of the entire electricity circular debt stock. The full DISCO-wise loss data is in Annexure A-1.
A grid that loses what it carries is not a neutral actor; it is an accomplice of the trap.
The Backbone Solution: 500 kV HVDC
Geography dictates the remedy. Pakistan needs a high-capacity, lowloss spine that connects southern generation to northern demand. High-Voltage Direct Current is the unsung hero here. Over distances exceeding 500 km, HVDC loses roughly 3 per cent of power, compared to 6–8 per cent for alternating current. It can carry more energy on fewer towers and can be controlled with surgical precision – vital for managing the variable flows that solar and wind bring.
The following corridors will turn the spine into a skeleton capable of carrying weight:
1. Matiari–Lahore upgrade: The existing line has operated well below its 4,000 MW capacity because supporting infrastructure is incomplete. A targeted upgrade can raise it to 6,000 MW.
2. Thar–Islamabad (new, 1,100 km): 5,000 MW of domestic coal and solar from the Thar Desert to the load centres of Punjab and Khyber Pakhtunkhwa.
3. Dasu–Lahore (new, 450 km): 3,000 MW of northern hydropower to the centre, sized to evacuate Dasu’s full staged output (4,320 MW planned) together with existing northern hydro balancing flows. A separate, dedicated transmission system for Diamer-Basha’s 4,500 MW is already under planning by WAPDA, with a phased commissioning window of 2032–2035. Together, the two corridors would unlock over 8,800 MW of northern hydropower.
4. 500 kV AC loop (Lahore-Islamabad-Faisalabad-Multan): This is a 500 km loop connecting the AC backbone across these Industrial hubs. Already funded to the tune of $330 million via the ADB Second Power Transmission Strengthening Project.
Combined with a 500 kV AC loop around the major cities, these corridors can lift national evacuation capacity from 30 GW to 60–75 GW by 2035 (see Annexure C-1), enough to unlock every watt of existing generation and all foreseeable new domestic supply. The total cost for the addition of currently planned 10 GW HVDC backbone is estimated at $2.63 billion, with $894.1 million already committed by the World Bank’s BEST-PAK programme and the ADB. Full corridor specifications and cost breakdowns are provided in Annexure B.
Distribution: the Last Mile, Where Most of the Bleeding Happens .
A shiny backbone is useless if the capillaries are blocked. The immediate plan targets a 3–5 percentage point reduction in losses within 24 months, using three low-cost tools (fully costed in Annexure B-2):
• Smart meters on the top-loss feeders (Rs 15 billion): once consumers know they are being measured, theft becomes riskier.
• Aerial bundled cable in theft-prone zones (Rs 25 billion): the copper thief cannot strip what is insulated.
• Transformer load management (Rs 10 billion): replacing overloaded units before they fail.
The combined Rs 52 billion investment pays for itself within 18 months to three years through recovered energy. But hardware alone cannot fix a broken institution. Pakistan’s DISCOs are governed by a system that rewards collections while ignoring losses. A utility that collects 95 per cent of bills but loses 12 per cent of input electricity is still declared a success. The remedy, detailed in Annexure A-2, is a hybrid model:
• Privatise the profitable DISCOs (IESCO, FESCO, GEPCO) immediately to set a benchmark
and attract international capital.
• Devolve the loss-makers (PESCO, QESCO, SEPCO, HESCO) to their host provinces with a five-year sunset clause: reform or be taken over.
K-Electric already showed that privatisation can work: it did not add a single rupee to circular debt in FY2025. The template exists; it only needs to be applied with discipline.
The Fiscal Arithmetic: Costs and Recoveries in One View
Before the section-by-section detail, it is worth compressing the whole fiscal equation into a single frame. The grid modernisation this paper proposes – the HVDC backbone, the smart meters, the distribution restructuring – will cost an estimated $6.5–9 billion over the next decade. Most of this will be financed through concessional multilateral loans (ADB, World Bank, AIIB, IsDB) at 2–3 per cent interest over 20-year tenors. After the Grid Recovery Mechanism captures 60 per cent of verified efficiency savings, the net annual call on the budget is projected at Rs 60–80 billion.
At the same time, offering export-oriented industries at Rs 20/kWh tariff (roughly 7 US cents) would cost the exchequer approximately Rs 320–330 billion in forgone revenue on existing sales, plus a modest amount for incremental fuel when new demand pushes beyond the idle-capacity envelope. The cross-subsidy gap that industry traditionally carried has already been substantially reduced; the residual burden is manageable.
Against these costs stand five powerful recoveries:
1. Capacity-payment dilution. Every additional gigawatt-hour of industrial consumption spreads the fixed Rs 2 trillion capacity obligation thinner. At the demand levels that Rs 20/kWh can unlock, this effect alone returns Rs 160–190 billion/year to the system.
2. Direct fiscal gains from export expansion. Even a conservative export uplift of $3–5 billion generates Rs 150–250 billion/year in GST, corporate tax, and supply-chain duties.
3. Interest savings from reduced external borrowing. Lower current-account pressure avoids expensive commercial debt and eventually compresses Pakistan’s sovereign risk premium, saving Rs 80–120 billion/year.
4. Import substitution. Reviving basic industry that had shut down because of unaffordable power replaces imported inputs with domestic output, saving Rs 50–80 billion/year.
5. Fuel-import displacement. Once the grid can deliver domestic electrons to northern demand centres, it displaces RLNG and furnace oil that would otherwise be burnt because cheap southern power cannot get through. Conservative estimates place this saving at Rs 200–350 billion/ year.
The net arithmetic, even after fully servicing the grid investment, is a surplus of Rs 150–400 billion/year. The transition – the period during which revenue losses bite before exports and fuel savings fully respond – can be bridged without imposing a single new tax on the petrol pump or the salaried class. The subsections that follow unpack each of these pieces.
The Arithmetic of Loss Reduction In FY 2025, Pakistan generated 127,159 GWh. With T&D losses averaging 17.55 per cent, approximately 22,300 GWh – worth Rs 265 billion at the average consumer tariff – simply evaporated before reaching a paying customer. Those lost units are not a technical footnote; they are a direct amplifier of the capacity trap. Every unit that leaks away shrinks the denominator over which the fixed Rs 2 trillion capacity charge is spread.
If losses can be driven down to NEPRA’s allowed benchmark of 11.43 per cent, a reduction of 6.12 percentage points, Pakistan would recover roughly 7,800 GWh of saleable electricity without commissioning a single new megawatt. Selling that recovered power at an average of Rs 30/kWh would generate Rs 234 billion in additional revenue, simultaneously lowering the per-unit fixed-cost burden on every honest consumer. Each percentage point of loss reduction trims that burden by approximately 0.8–1.0 per cent. A full 6.12-point reduction would deliver a 5–6 per cent consumer tariff cut – not through subsidy or renegotiation, but through simple delivery.
Export-First Tariff: Rs 20/kWh by 2027
The volume solution’s strongest leverage is with industries that earn foreign exchange. When the government priced incremental industrial consumption at Rs 22.98/kWh from December 2025 to February 2026, industrial demand surged by 12 per cent year-on-year, adding 2,164 GWh of new offtake in a single quarter. That live experiment confirms what the textbooks predict: demand is highly responsive to price, and the grid is hungry for more electrons.
At Rs 20/kWh – a 42 per cent reduction from the current Rs 34.75/kWh baseline – industrial consumers that had retreated to expensive captive generation or simply idled capacity would return to the grid. Conservatively, a dedicated export-track tariff could unlock 10,000–12,000 GWh of additional annual consumption from the textile and apparel sector alone, with demand elasticity data from the All Pakistan Textile Mills Association suggesting even larger potential as confidence builds.
The fiscal flywheel is straightforward: cheaper power → higher exports → more foreign exchange→ reduced external borrowing → lower interest costs → fiscal room to protect vulnerable residential consumers and reinvest in the grid. But the flywheel also spins off a human dividend. Pakistan’s textile sector is among the largest employers in the country, and every billion dollars of additional exports supports roughly 25,000 direct jobs in spinning, weaving, finishing, and stitching, and another 75,000 indirect jobs across cotton growing, logistics, packaging, and retail. Even the conservative export uplift that a Rs 20/kWh tariff can unlock – $3–5 billion annually –translates into 75,000–125,000 direct jobs and 225,000–375,000 indirect jobs. In a country where youth unemployment is a persistent tinderbox, this is not merely a macroeconomic statistic; it is a stake in social stability.
The bridge between the immediate revenue loss and the export response must not be found in further burdening the petrol pump. The petroleum levy has already been stretched to breaking point, tripling from Rs 20 per litre in 2022 to over Rs 117 per litre for petrol and Rs 160 per litre for high-speed diesel by April 2026 – a tax without a statutory ceiling, imposed by executive notification without parliamentary vote, and now functioning as an undeclared capacity-payment levy that extracts over Rs 1,450 billion a year from motorcycle riders, transport workers, and ordinary households. It is the most regressive instrument in the fiscal arsenal, and it cannot bear another rupee.
The sustainable alternative lies in a revenue stream that currently yields almost nothing yet ought to be among the largest in the country: the Agricultural Income Tax (AIT). Agricultural income is a provincial domain under the 18th Amendment. While constitutionally assigned to provinces, AIT collection has historically yielded <5% of potential revenue. A phased, CCI-negotiated floor target with NFClinked incentives reduces political friction while securing the transition bridge.
This preserves the constitutional assignment of the tax to the provinces while creating a powerful fiscal incentive for them to either collect it or concede the revenue to the Centre. Rich absentee landlords have been left largely untouched while the salaried class and industrial consumers have borne the entire weight of fiscal adjustment. Even the IMF, in its 2025 Extended Fund Facility review, noted bluntly that “significant obstacles to realising the full potential of AIT remain.” The 11th National Finance Commission, constituted in late 2025 to replace the 15-year-old 7th NFC Award, has been urged by economists and fiscal experts to bring agricultural income into the federal tax net as part of a broader recalibration.
The mechanism proposed here is straightforward: the federal government should enact legislation bringing agricultural income tax under FBR collection and administration, with the proceeds dedicated to a ring-fenced Structural Reform Bridge Fund that finances the revenue shortfall incurred by the export-first tariff during its transition years. Should the provinces object – and the constitutional obstacle is real, since Article 160 and the 18th Amendment make agricultural income a provincial subject – a clean alternative exists that requires no constitutional amendment at all: the federal government, through the Council of Common Interests, could agree that any province that does not meet a prescribed minimum agricultural-income-tax collection target (set at, say, 25 per cent of the province’s estimated agricultural-income-tax potential) will have the uncollected shortfall deducted from its share of the next NFC Award and transferred to the Structural Reform Bridge Fund. Either way, the bridge is funded not by taxing the petrol pump further but by finally taxing a source of income that has escaped contribution for decades.
This is not a handout. It is the most cost-effective fiscal intervention available to the state. And it comes with jobs attached.
Proof of Concept: the 1 GW Demand-Swap Pilot
Before the full HVDC backbone is operational, a targeted pilot can demonstrate – in real time and with measured results – that filling the inn’s rooms works.
The government would select three high-density urban clusters – for instance, specific industrial zones in Lahore, Faisalabad, and Karachi – and orchestrate a deliberate shift of 1,000 MW of gas-dependent cooking, water-heating, and small-industrial load onto the electricity grid. Induction hobs, heatpump water heaters, and time-of-use industrial tariffs would be deployed in tandem with the local grid upgrades – smart meters, reinforced transformers, and aerial bundled cable – to ensure that the additional load is met without tripping feeders.
By absorbing 1 GW of idle capacity, the pilot would lower the national capacity-fee burden by an estimated Rs 50–70 billion in the first year alone. More importantly, it would generate the data –hourly load profiles, consumer acceptance surveys, DISCO performance metrics – that policymakers and investors need to scale the model to 10 GW nationally. The pilot is not a gamble; it is an underwriting exercise: prove the principle on a small, manageable scale, then replicate.
Financing the Rewiring: The Grid Recovery Mechanism
Grid modernisation is often presented as a fiscal impossibility – a capital-intensive investment that a cash-strapped government cannot afford. The opposite is true. The annual drain from grid inefficiency (Rs 265 billion in excess losses, Rs 132 billion in poor recovery, Rs 56 billion in inefficient dispatch payments) exceeds Rs 450 billion every year. The investment required to stop that drain is $6.5–9 billion over a decade – roughly the same order of magnitude as the cumulative loss over the same period if nothing is done.
The Grid Recovery Mechanism (GRM) turns this arithmetic into a self-financing engine. The GRM is a ring-fenced, independently verified accounting framework:
• 60 per cent of verified annual savings from loss reduction, improved recovery, and decongestion is channelled into a Grid Modernisation Fund (GMF).
• The remaining 40 per cent flows directly to consumer tariff relief and circular debt reduction.
• Disbursements from the GMF are triggered only against independently verified milestones – kilometres of HVDC commissioned, smart meters activated, loss-percentage points closed.
• A sunset clause extinguishes the GRM once T&D losses fall below 11.43 per cent for two consecutive years and the full investment has been recovered.
Concessional multilateral financing (ADB, World Bank, AIIB, IsDB) provides the upfront capital at 2–3 per cent interest over 20- year tenors, while the GRM guarantees the repayment stream from captured savings (committed and gap financing details are in Annexures E-1 and E-2). At current savings rates, the full $6.5–9 billion investment would be recovered within 7–8 years. After that, every rupee of efficiency gain flows directly to consumers and the national exchequer.
The GRM is not a new tax. It is a commitment device: stop leaking, and the savings will pay for the cure.
Smart Grid Enablers
A modernized grid is not just about steel and copper; it is about intelligence. Three systems must be deployed alongside the physical upgrades.
Real-time monitoring and control. SCADA and Energy Management Systems, already partially deployed, must achieve nationwide transmission-operator coverage. At the distribution level, Advanced Distribution Management Systems and Phasor Measurement Units will give DISCOs the visibility they currently lack. With behind-the-meter solar already exceeding 20 GW, Distributed Energy Resource Management Systems (DERMS) must be mandated to aggregate rooftop solar and batteries as virtual power plants, turning a grid destabilizer into a grid asset. All new solar installations above 5 kW should be required to use smart inverters compliant with IEEE 1547-2018.
Time-of-use tariffs and demand response. Smart meters enable what flat-rate billing cannot: price signals that shift industrial and commercial load from expensive peak hours (5 pm–9 pm, Rs 35/ kWh) to off-peak periods (9 pm–6 am, Rs 15/ kWh). EV charging and export-industry loads are prioritized for off-peak rates under the export-first tariff track. The detailed tariff structure is set out in Annexure D-1. Cybersecurity for the grid edge. A smarter grid is a more vulnerable grid unless security is designed in from the start. All grid-connected distributed energy resources above 50 kW must comply with IEC 62443 industrial cybersecurity standards. Critical transmission nodes should operate on air-gapped SCADA, and all operational data must be stored on Pakistani servers with access protocols approved by the National Cyber Security Authority. The integration of EV charging networks, smart meters, and behind-the-meter solar creates a vastly expanded attack surface; the time to secure it is before it is built, not after. The full risk register – covering political interference, provincial resistance, disbursement delays, and cyber threats – is presented in Annexure F-1.
Sequencing and Milestones (2026– 2035) Detailed suggested implementation sequencing with milestones to be achieved for the next decade (2026–2035) are listed in Annexure G.
Next: The Road to the Inn
Part II has shown how to rewire the system so that the inn’s rooms can be used safely and profitably, in any season. The backbone is designed. The Grid Recovery Mechanism ensures that the cure finances itself. The export-first tariff track demonstrates that filling the rooms with productive, foreign-exchange-earning industry is not merely possible – the live data from the winter 2025–26 pricing experiment already proves it works. What began in Part I as a diagnosis of empty rooms and mounting bills now has an engineered pathway to solvency: stop losing what has already been paid for, deliver it efficiently, and let demand do the rest. Part II provides the innkeeper with a wiring diagram; Part III will provide a paved road – and a fare that the guests can afford. The guests will not be far behind. The only remaining question is whether policy will connect the two in time.
References
1. National Electric Power Regulatory Authority. (2025). State of Industry Report 2024-25. https://www.nepra.org.pk/Publications.htm
2. NEPRA. (2026). DISCO Performance Evaluation Report 2025 (T&D losses and financial impact data).
3. Power Planning & Monitoring Company. (2026, February). Circular debt stock data. (As cited in Business Recorder)
4. Ministry of Energy (Power Division). (2025, July). Briefing to National Assembly Standing Committee on Power (Installed capacity vs. evacuation).
5. Asian Development Bank. (2025). Second Power Transmission Strengthening Project (Project No. 59002-001). https://www.adb.org/projects/59002-001/main
6. World Bank. (2025). Boosting Energy Security through Transmission in Pakistan (BEST-PAK) Program (Project ID P504536). https://projects.worldbank.org/
7. Auditor General of Pakistan. (2025). Audit Report on Power Sector 2024-25 (KE circular debt comparison).
8. Central Power Purchasing Agency (Guarantee). (2025). Monthly fuel data and generation mix report. https://www.cppa-g.com/
9. Institute for Energy Economics and Financial Analysis. (2025). Pakistan’s Transmission System Expansion Plan (TSEP) 2024-2034.
10. State Bank of Pakistan. (2025). Circular debt financing facility terms (KIBOR minus 0.9%).
11. Pacra. (2026, April). Grid Bottleneck Analysis & Evacuation Capacity Assessment.
12. CPPA-G. (2025). Monthly Fuel & Dispatch Report, FY2025 Summary.
13. Mettis Global. (2025, April). K-Electric Performance & Circular Debt Analysis.
14. Power Division. (2026, February). Distributed Solar & Net-Metering Dashboard Briefing.
15. Ministry of Petroleum. (2026, February). Gas Sector Circular Debt & UFG Briefing to National Assembly.
16. Oil & Gas Regulatory Authority (OGRA). (2025). Performance Evaluation of Gas Utilities.
17. IMF. (2025). Pakistan: Extended Fund Facility Review – Staff Report.
18. All Pakistan Textile Mills Association. (2024). Demand Elasticity Analysis – Member Consumption Data.
Annexure A.
A-1. Distribution Losses by DISCO
NEPRA’s State of Industry Report 2025 provides the following DISCO-wise T&D loss data (FY2024-25):
| DISCO Name | T&D Loss % | Recovery % | Cumulative (AT&C) Loss % | Annual Loss (PKR Billion) |
| QESCO | 38.4% | 38.7% | 76.2% | RS. 52.41 |
| SEPCO | 39.2% | 74.2% | 54.9% | RS. 36.04 |
| HESCO | 27.9% | 74.8% | 46.1% | RS. 27.14 |
| PESCO | 37.1% | 91.5% | 42.4% | RS. 87.48 |
| K-Electric | 14.1% | 90.6% | 22.8% | RS. 74.66 |
| MEPCO | 13.8% | 100.0% | 13.8% | RS. 14.00 |
| LESCO | 13.7% | 101.3% | 12.6% | RS. 35.17 |
| GEPCO | 10.6% | 100.0% | 10.6% | RS. 5.00 |
| FESCO | 9.0% | 100.0% | 9.0% | RS. 3.00 |
| IESCO | 8.6% | 100.0% | 8.6% | RS. 5.00 |
| TESCO | 8.3% | 100.0% | 8.3% | Negligible |
| National Average | 17.5% | – | 24.21% | Rs 339.90 |
Source: NEPRA Performance Evaluation Report 2025.
When poor bill recovery (average 96.62% against 100% target) is added, the combined annual
financial burden of DISCO inefficiency approaches Rs 397 billion, equivalent to nearly one
quarter of the entire electricity circular debt stock.
A-2. A Hybrid Devolution-Privatisation Model
| DISCO Category | Action | Timeline | Rationale |
| Profitable DISCOs (IESCO, FESCO, GEPCO) | Federal privatisation | 2026-2027 | Attract international investment; set benchmark |
| Loss-making DISCOs (PESCO, QESCO, SEPCO, HESCO) | Devolution to provinces with 5-year sunset clause | 2026 devolution; 2031 deadline for reform/privatisation | Creates provincial fiscal accountability; preserves option for later privatisation |
This hybrid model respects the 18th Amendment while ensuring that loss-making DISCOs cannot indefinitely bleed the national circular debt.
Annexure B.
B-1. Proposed HVDC Corridors
| Corridor / Project | Length (km) | Capacity (MW) | Estimated Cost ($ million) | Status |
| Phase 1 – Immediate (2026-2028) | ||||
| Matiari-Lahore (existing, upgrade) | 878 | 4,000 → 6,000 | 400 | ADB financing committed |
| Thar-Islamabad (new) | 1,100 | 5,000 | 1,200 | Feasibility stage |
| Dasu-Lahore (new, for hydropower) | 450 | 3,000 | 700 | World Bank BEST-PAK |
| 500 kV AC loop (Lahore-Islamabad-Faisalabad-Multan) | -500 (aggregate) | – | 330 | ADB Second Power Transmission Strengthening Project |
| Phase 1 sub-total | 10,000 | 2,630 | ||
| Phase II – TSEP 2024-34 pipeline (2028-2035) | ||||
| Additional 500 kV HVDC/HVAC corridors, substation reinforcements, reactive power compensation, and smart-grid integration identified in NTDC’s Transmission System Expansion Plan; includes dedicated Diamer-Basha evacuation (4,500 MW, 2032-35) and southern-corridor decongestion. | 878 | 15,000-20,000 | 5,500-6,500 | Various stages of feasibility / pre-procurement |
| Total Transmission Expansion | 1,100 | 30,000-35,000 | 8,130-9,130 | |
Sources: ADB Second Power Transmission Strengthening Project; World Bank BEST-PAK appraisalThe World Bank‑led BEST‑PAK program is already supporting, with expected financing of $698.75 M, comprising $378.9 M from the World Bank, $92.5 M from the AIIB, $92.7 M from the IsDB, and $134.6 M from the Government of Pakistan.
B-2. Immediate Loss Reduction Measures (0-24 Months)
| Measure | Estimated Cost | Expected Loss Reduction | Payback Period |
| Smart meters for top 20% loss feeders | Rs 15 billion | 1.5-2.0 pp | 24-36 months |
| Aerial bunched cable (ABC) replacement for theft-prone feeders | Rs 25 billion | 2.0-2.5 pp | 18 months |
| Transformer load management (replacement of overloaded units) | Rs 10 billion | 0.5-1.0 pp | 12 months |
| GIS mapping of all feeders | Rs 2 billion | 0.5 pp (enables targeted action) | 6 months |
Total immediate investment: Rs 52 billion. Expected annual savings from loss reduction: Rs 80-100 billion.
Annexure C.
C-1. Current vs. Target Evacuation Capacity
| Metric | Current (2026) | Target (2030-35) | Improvement |
| Installed generation capacity | 46,600 MW | 60,000-75,000 MW* | +13,400 to +28,400 MW |
| Peak evacuation capacity | 30,000 MW | 60,000-75,000 MW | +30,000 to +45,000 MW |
| Stranded capacity** | 16,600 MW (35%) | Nil | Nil |
| Capacity payments for stranded capacity | Rs 580 bn/year | Nil | -Rs 580 bn/year |
* Includes existing capacity + new domestic-resource generation (Thar coal, hydro, nuclear, renewables).
* Stranded capacity here refers to generation that cannot be evacuated due to transmission constraints. Residual idle capacity due to demand variation or operational reserve is addressed through the volume-solution mechanisms described in the Fiscal Arithmetic and Export-First Tariff sections.
Annexure D.
D-1. Time-of-Use Tariffs and Demand Response
| Period | Hours | Tariff (PKR/kWh) | Objective |
| Peak | 5pm-9pm | 35 | Discourage high-cost consumption |
| Shoulder | 9am-5pm | 25 | Encourage solar alignment |
| Off-peak | 9pm-6am | 15 | Absorb excess hydro/solar & EV charging |
Annexure E.
E-1. Committed Financing (as of April 2026)
| Source | Amount ($ million) | Project |
| ADB | 330 | Second Power Transmission Strengthening Project (HVDC upgrade) |
| World Bank (BEST PAK) | 378.9 | 500kV Matiari-Rahim Yar Khan corridor |
| AIIB | 92.5 | Co-financing with World Bank |
| IsCB | 92.7 | Co-financing with World Bank |
| Total | 894.1 |
The remaining $5.6-8.1 billion gap must be mobilised through blended mechanisms.
E-2. Gap Financing Mechanisms
| Mechanism | Expected Contribution ($ billion) | Terms |
| Concessional climate finance (GCF, GEF, KfW) | 1.5, 2.0 | 2-3% interest, 20-year tenor |
| Public Private Partnerships (transmission lines) | 1.0, 1.5 | 15-18% IRR for private partner |
| Diaspora / green bonds | 1.0, 1.5 | 6-8% coupon, 10-year maturity |
| Government allocation (circular debt reduction savings) | 2.0, 3.0 | Direct budget reallocation |
| Total gap coverage | 5.5, 8.0 |
Note: Exchange rate assumption: PKR 280/ USD.
Annexure F.
F-1. Risks and Mitigation
| Risk | Likelihood | Impact | Mitigation | Owner |
| Political interference in DISCO operations | High | High | Legislative lock-in on performance metrics; CCI-backed implementation (as in Part I) | Parliament / CCI |
| Provincial resistance to devolution of loss-making DISCOs | Medium | High | Offer fiscal incentives (e.g., debt write-off upon devolution); sunset clause with automatic federal reversion | Ministry of Energy |
| Delayed multilateral disbursements | Medium | Medium | Contingent domestic financing window (circular debt savings ring-fenced) | Ministry of Finance |
| Cybersecurity breach of grid control systems | Low | Critical | Mandatory IEC 62443 compliance; air-gapped SCADA for critical nodes; NCA oversight | NCA / NEPRA |
| Shortfall in anticipated loss reduction savings | Medium | Medium | Conservative planning (assume 60% of target savings); diversified financing stack | NEPRA / DISCOs |
Annexure G.
G-1. Sequencing and Milestones (2026–2035)
| Year(s) | Milestone |
| 2026 | Establish FY2025 baseline for T&D losses, recovery rates, and inefficient-dispatch exposure. Tender Thar-Islamabad HVDC corridor. Begin devolution of loss-making DISCOs with five-year sunset clause. Launch first diaspora green bond. |
| 2026-2027 | Privatise profitable DISCOs (IESCO, FESCO, GEPCO). Secure $1 billion from Green Climate Fund and concessional climate finance. |
| 2027 | Achieve Rs 20/kWh tariff for certified export industries. Complete Matiari-Lahore HVDC upgrade. Deploy SCADA for all DISCOs; pilot DERMS in Lahore. |
| 2028 | Commission Thar-Islamabad HVDC (5,000 MW). Smart meters installed for top-loss feeders; aerial bundled cable deployed in high-theft zones. Fully operationalise GRM with ring-fenced accounting. |
| 2029-2032 | Reduce national T&D losses to below 12 per cent. Complete 500 kV HVAC loop around major load centres. Achieve $3 billion in PPP investment for transmission lines. Mandatory smart inverters for all new solar above 5 kW. |
| 2030 | First imported-fuel PPAs expire; apply “domestic fuel only” renewal filter. |
| 2031 | Deadline for loss-making DISCOs to reform or be privatised. Average industrial tariff reaches Rs 20/kWh on the domestic track. |
| 2032 | Fully automated demand response; VPP aggregation of behind-the-meter solar. |
| 2033-2035 | T&D losses below 10 per cent nationally. Evacuation capacity reaches 60–75 GW. All DISCOs either privatised or provincially restructured. Full cost recovery of grid investment via GRM; residual fund transferred to National Energy Transition Fund. |