



Making the Transition Practical
This multi-part series examines Pakistan’s energy vulnerability through complementary strategic lenses. Part II provided a deep dive into grid transmission and the Grid Recovery Mechanism. This third instalment delivers a comprehensive, data-driven blueprint for transport electrification – including a two-year mandatory cutoff for new internal combustion engine (ICE) passenger vehicles, a Battery-as-a-Service (BaaS) ownership model, and a self-financing charging levy that replaces the petroleum levy without requiring additional tax reforms.
Special Series: Reclaiming Sovereignty – Part III
Executive Summary: Pakistan’s Rescue from the Energy Trap
Pakistan’s macroeconomic stability is bound to an acute energy vulnerability: an annual petroleum import bill reaching $18 to $20 billion. This cost drains foreign reserves and exposes the local currency to sharp global shocks. Nearly 40% of the country’s petrol is consumed by its 30 million 2-wheeler and 3-wheeler vehicles. For these everyday citizens, delivery drivers, and small business owners, transitioning to electric vehicles (EVs) is the only viable path to economic relief. However, upfront battery costs – which make up 30% to 40% of an EV’s retail price – have created an unyielding barrier to mass-market adoption.
This paper details a self-financing, market-driven policy blueprint to dissolve this cost barrier. By decoupling the battery from the vehicle through a Battery-as-a-Service (BaaS) infrastructure network, the upfront cost of a local EV chassis drops directly below its petrol equivalent.
This transition relies on three core operational mechanisms:
- A Phased Regulatory Cutoff: Imposing a firm ban on new CBU imports by 2027 and setting a mandatory target for standard ICE manufacturing phase-outs to force a structural shift toward smart, swap-compatible EV architectures.
- Grid Optimization via the Midnight Valley: Directing EV charging loads into the off-peak night window (12 AM to 6 AM) to absorb 17 GW of stranded electricity capacity that the state is already paying for under rigid “take-or-pay” contracts. This mechanism turns a national liability into a productive economic asset without requiring new grid investments.
- A Self-Financing Revenue Architecture: Replacing lost petroleum taxes by applying a uniform PKR 10/kWh levy on energy delivered to swap stations. Combined with massive off-peak grid savings, this levy generates a net fiscal surplus of PKR 1.66 trillion for the state between 2026 and 2034.
Private investors backing the BaaS asset pools and swapping infrastructure achieve a competitive project-level IRR of 18% to 23%, outperforming traditional utility and energy concessions. Concurrently, standard commercial drivers enjoy immediate financial savings of 20% to 44% on monthly fuel expenses.
By scaling this model to 12 million e-bikes and half a million e-rickshaws by 2035, Pakistan can successfully transition its transit backbone away from imported oil and toward cheap, domestic hydel, nuclear, and distributed solar power. This strategy represents far more than a technical or environmental transition – it is a clear path to reclaiming national energy sovereignty.
The Narrative Continues
The inn is wired. Part II of this series described how a 500 kV backbone, smart meters, and a self-financing Grid Recovery Mechanism ensure that every socket can carry the load. The lights are on; the heaters are ready. But the road leading to the inn remains a rutted, expensive dirt track. Only a handful of wealthier tourists with private jeeps can manage the journey. The millions who ride two-wheelers – students, delivery drivers, small-shop owners – simply cannot afford the trip. Pakistan’s transport electrification faces exactly this challenge. The strategic case has been made: a phased phase-out of ICE vehicles, solar-powered charging corridors, and staggering import-bill savings. But between the vision and the vehicle stands the showroom floor. For the 30 million two- and three-wheeler riders who consume nearly forty percent of the nation’s petrol, the road to electrification remains blocked by a single, immovable obstacle – the upfront cost of the lithium-ion battery.
This paper removes that obstacle. It does so by integrating a mandatory policy shock, a Battery-as-a-Service (BaaS) ownership model, and a fiscally self-financing charging levy – all grounded in the post-war energy reality. The BaaS is a globally proven model with great success in India and China. It provides the paved road that makes electrification not only possible but economically irresistible for the common citizen.
1. The Post-War Energy Trap – Why We Must Act Now
The Iran-US peace deal signed on 19 June 2026 has fundamentally altered global oil markets. Brent crude, which peaked above $110/bbl during the conflict, now trades in the $79-80/bbl range. Pakistan’s petroleum prices have followed suit, with petrol currently at Rs 299.50 per liter and high-speed diesel at Rs 311.47 per liter (effective 20 June 2026).
However, the petroleum levy (PDL) on petrol has dropped from Rs 116.08 per liter to Rs 66.25 per liter, significantly reducing cost for retail consumers. The FY27 PDL collection target has been set at Rs 1.677 trillion.
For the purpose of this analysis, we adopt two conservative price floors for petrol – PKR 225/L and PKR 250/L – reflecting the post-peace deal baseline, with the understanding that the petroleum levy creates a floor below which retail prices cannot easily fall. The dual analysis ensures our policy recommendations remain viable even under volatile global conditions.
Pakistan’s petroleum import bill reached $13.5 billion during the first 10 months of FY26, increasing 2% year-on-year. The country imports roughly $18-20 billion worth of petroleum products including LNG annually. At the height of the recent conflict, the weekly oil import bill surged by an additional 167% from ~$300 million to ~$800 million. This is the trap that transport electrification can spring. By shifting demand from imported finished fuels to domestically generated electricity, Pakistan can eliminate its vulnerability to international energy shocks and permanently insulate its balance of payments.
2. The Battery Ownership Barrier – And How BaaS Dissolves It
An electric vehicle costs far less to run than a petrol one – even before accounting for lower maintenance. But the upfront purchase price has traditionally been a wall, almost entirely because of the battery, which accounts for 30-40% of the vehicle’s cost.
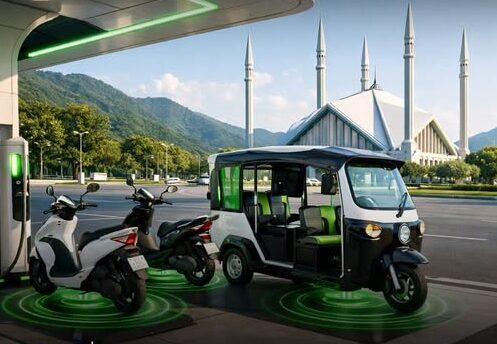
Battery-as-a-Service (BaaS) dissolves this wall. Instead of owning the battery, the consumer buys only the vehicle chassis (including motor, controller, and body) and pays a small, predictable monthly fee for the battery lease. The battery becomes a service, not an asset. The upfront cost drops sharply, and the consumer never faces the terrifying prospect of a dead battery and a replacement bill arriving without warning.
For two- and three-wheelers, the EV chassis is already cheaper than its petrol equivalent. For small cars, a modest premium remains – but as Appendix Table 2 shows, the monthly operational savings rapidly offset this difference, particularly when paired with off-grid solar.
3. FY2026-27 Budget: Key Incentives Retained
The FY2026-27 budget has retained critical incentives for EV adoption:
- 1% sales tax on locally assembled EVs has been retained for vehicles with battery capacities up to 50 kWh.
- Customs duty exemptions on CKD kits for electric vehicles have been extended until 30 June 2027.
- Concessional GST (8.5-12.75%) continues for hybrid EVs.
- The Pakistan Accelerated Vehicle Electrification (PAVE) scheme has been introduced, offering subsidized financing for e-bikes and e-rickshaws.
These incentives mean that small EV cars remain competitively priced. For example, the Honri Ve 3.0, Pakistan’s first locally assembled EV hatchback, is priced at approximately PKR 4,399,000 (ex-factory) for the full vehicle. Under BaaS, the battery (approximately PKR 1.5-1.65 million) is removed, leaving a chassis price of approximately PKR 2.75-2.9 million – a premium of about PKR 625,000 over a petrol 660cc car.
4. The Two-Year Policy Shock – Mandatory Cutoff and Fleet Transformation
A nationwide transition will not happen by gentle encouragement. This blueprint proposes a hard, statutory cutoff: a total ban on the import of completely built-up (CBU) internal combustion engine (ICE) passenger vehicles by 2027, followed by a phased restrictions roadmap for locally manufactured variants.
Implementation Timeline
- 2026-2027: National battery standard issued. Pilot swap networks deployed in Lahore, Karachi, and Islamabad-Rawalpindi. Complete ban on all new non-NEV CBU imports takes effect by 2027.
- By December 2028: All new two-wheelers and three-wheelers must be swap-compatible or pure EVs with Battery-as-a-Service (BaaS). Local 4-wheeler manufacturing must shift entirely away from standalone ICE options.
- 2029-2031 (The PHEV Transitional Bridge): New local 4-wheeler sales are restricted to PHEVs with a minimum 50km pure electric range or battery electric vehicles (BEVs). Standard ICE manufacturing is prohibited.
- 2032 Onward (The Pure NEV Mandate): PHEV tax privileges taper off. Local assembly lines must fully transition to localized BEVs and zero-emission architectures. Legacy fleets are systematically retired through escalating token and carbon taxes.
Using a stock-and-flow model that respects actual vehicle turnover rates – 10 years for two-wheelers, 8 years for three-wheelers, and 15 years for cars – this policy framework delivers a realistic yet transformative fleet penetration. By 2035, 80% of two-wheelers, 97% of three-wheelers, and 56% of cars/SUVs will be electric. The detailed annual penetration trajectory is presented in Appendix Table 3.
5. Consumer Economics – The Numbers That Matter
The financial case for the consumer is built on three pillars: lower energy cost, lower maintenance, and (for two/three-wheelers) lower upfront price. All detailed calculations – including dual-price analysis at PKR 225/L and PKR 250/L – are presented in Appendix Tables 4 through 6. The conclusions are unambiguous:
For two- and three-wheelers, the BaaS model delivers instant payback. The chassis is cheaper upfront, monthly fuel costs are roughly halved, and maintenance is drastically reduced. A private two-wheeler rider saves thousands of rupees per month. A delivery rider or commercial rickshaw operator, covering higher mileage, saves even more – making the transition a pure business decision with ROI from day one.
For small passenger cars, the economics are more nuanced. At PKR 225/L petrol, the monthly savings over a 660cc equivalent are modest (approximately 1-3%). However, if petrol remains at PKR 250/L, the savings become respectable (approximately 12%). The true game-changer for cars is pairing the EV with an off-grid solar system. This eliminates the monthly energy bill entirely, delivering savings of approximately 35-40% and a solar payback of under five years. For low-mileage users, the premium of an EV chassis over an ICE car is best understood as an investment in energy independence – and a hedge against future oil price and availability shocks.
6. Grid Integration – The Midnight Valley and Circular Debt Cure
Pakistan’s national grid experiences a dramatic daily swing. During off-peak hours (12 am – 6 am), baseline demand falls to ~11-13 GW, leaving nearly 17 GW of stranded capacity that the government already pays for under take-or-pay contracts.
By shifting EV charging into the midnight valley using Time-of-Use smart meters, the EV fleet acts as a demand sponge, absorbing idle capacity without requiring new generation. Under the 50/50 hybrid model, 50% of station energy is drawn from the grid during off-peak hours, directly utilizing otherwise wasted capacity. The remaining 50% comes from behind-the-meter solar, reducing grid dependence and stabilizing local distribution feeders.
Under our realistic penetration model, total station energy demand reaches approximately 17 billion kWh by 2035, of which roughly 8.5 billion kWh is drawn from the grid (the balance being solar). This off-peak grid draw absorbs stranded capacity and directly reduces circular debt. The year-by-year build-up of grid draw and associated savings is detailed in Appendix Table 8.
7. Fiscal Realignment – The PKR 10/kWh Levy
The loss of petroleum development levy (PDL) revenue as ICE vehicles are phased out is a valid concern. However, this blueprint offsets that loss by introducing a uniform PKR 10/kWh levy on all energy delivered to swap stations (including solar). This levy is applied to the station’s meter and collected by the government.
The arithmetic is compelling:
- The levy generates substantial revenue from grid draw – reaching approximately PKR 85 billion annually by 2035.
- The grid savings (avoided capacity payments from utilizing off-peak stranded capacity) add another approximately PKR 400 billion annually by 2035.
- This yields a total fiscal benefit of approximately PKR 487 billion.
- The gross PDL foregone in 2035 – using a direct comparison of petrol demand displaced – is estimated at approximately PKR 518 billion.
The result is a net fiscal surplus every year from 2026 through 2034, with a cumulative surplus of over PKR 1.6 trillion over those nine years. In 2035, as EV penetration reaches its peak, the net position approaches breakeven. This leaves the government with a full eight-year window to implement complementary tax reforms, expand the retail tax base, and, if desired, adjust the petroleum levy rate to further discourage fossil fuel consumption. The policy is fiscally self-financing, and the modest 2035 gap – less than 0.15% of annual government revenue – is well within the scope of ongoing fiscal reforms. Crucially, the breakeven petrol price – where petrol becomes cheaper to run than EV – for a two-wheeler is approximately PKR 110/L, far below even the most conservative post-peace price floor. Thus, the levy does not harm consumer adoption.
8. The Broader Macroeconomic Dividend – CAD Relief and Power Sector Transition
The fiscal arithmetic presented above captures only the direct revenue substitution between the Petroleum Development Levy (PDL) and the proposed PKR 10/kWh EV charging levy. However, the true sovereign dividend extends far beyond the government’s direct ledger—it fundamentally restructures Pakistan’s current account deficit (CAD) vulnerabilities and accelerates its transition toward an indigenous power sector.
8.1 The Current Account Deficit Relief: The $18–20 Billion Structural Vulnerability
Pakistan’s petroleum import bill remains a persistent and debilitating drain on foreign exchange reserves. During the first 10 months of FY26, the petroleum import bill reached $13.5 billion, putting the country on track to maintain its historical annual import dependency of $18 to $20 billion. Total annual consumption stands at approximately 18 to 19 million metric tons (MMT) of petroleum products. At the height of recent global conflicts, geopolitical supply shocks exposed this vulnerability, causing the weekly oil import bill to surge an additional 167%, spiking from $300 million to $800 million.
The transport sector accounts for the largest share of this consumption, demanding approximately 1.25 million metric tons of finished fuel every month. The table below outlines how this total monthly volumetric demand is divided between the immediate target for EV displacement (ICE transport) and the broader industrial ecosystem:
| Import Sector Baseline | Petroleum Product Category | Average Monthly Volume | Primary End-Use & Displacement Potential |
| ICE Transport Footprint (~1.25 MMT / Month total) | Motor Spirit (Petrol) | ~667,000 Metric Tons | Immediate target for replacement via 2W, 3W, and Passenger EV charging. |
| High-Speed Diesel (HSD) | ~580,000 Metric Tons | Heavy freight transport, city BRT networks, and Pakistan Railways logistics. | |
| Non-ICE Industrial Footprint (~1.6 – 1.8 MMT / Month total) | Crude Oil (Raw) | ~850,000 to 900,000 MT | Local refinery feedstock utilized to extract industrial chemicals, solvents, and base oils. |
| Liquefied Natural Gas (LNG) | ~600,000 to 750,000 MT | Imported power generation fuel for RLNG plants and thermal textile manufacturing energy. | |
| Liquefied Petroleum Gas (LPG) | ~70,000 to 85,000 MT | Domestic cooking and commercial heating fuel for off-grid rural regions. | |
| Lubricants, Waxes & Bitumen | ~50,000 to 65,000 MT | Industrial machinery gear oils, asphalt for road surfacing, and manufacturing raw materials. |
By aggressively displacing petrol demand with domestically generated electricity, the EV mandate directly targets a baseline expenditure of over $650 million per month in finished fuel imports. This structural shift delivers:
- Direct USD Savings: Immediate conservation of foreign exchange as the absolute volume of imported petrol drops.
- Currency Stabilization: Reduced structural downward pressure on the PKR/USD exchange rate by smoothing monthly import demand.
- Sovereign Liquidity: An improved current account position that frees up central bank reserves for critical industrial raw materials and external debt servicing.
Even under a conservative penetration model, the cumulative reduction in petrol imports by 2035 will insulate Pakistan from international oil price shocks, strengthening the sovereign external position.
8.2 The Untouched Frontier: Diesel, HTVs, and Railways
While this initial phase focuses on the rapid electrification of 2-wheelers, 3-wheelers, and passenger cars, a vast diesel-dominated frontier remains. Heavy Transport Vehicles (HTVs) move the vast majority of national freight and consume approximately 580,000 tons of HSD per month. These vehicles remain the primary contributors to urban air pollution and smog. With nearly 20% of tested HTVs failing basic emission standards, the economic and environmental case for transport transition is urgent.
Similarly, Pakistan Railways consumes roughly 350,000 liters of diesel daily, creating an acute operational burden that scales rapidly with every upward adjustment in domestic HSD prices. Transitioning regional freight corridors to hybrid or battery-electric locomotives would eliminate this recurring drain on public finances. Fortunately, the public transit sector is already proving the viability of this model. Punjab has mobilized a mass transit expansion plan, including an allocation of PKR 143 billion targeted at introducing up to 2,000 electric buses. Concurrently, a World Bank-funded program is deploying 256 electric buses for the Karachi BRT network, alongside localized green transit initiatives in Khyber Pakhtunkhwa. Expanding this framework to the commercial freight ecosystem will eventually reduce transport-related import dependencies to negligible levels.
8.3 Power Sector Transition: Retiring Expensive Thermal Capacity
The EV charging load that replaces imported petrol does not require the construction of new generation capacity. Instead, it absorbs the approximately 17 GW of installed capacity that remains underutilized during the midnight valley – capacity for which the state is already paying under take-or-pay independent power producer (IPP) contracts. This utilizes capacity that currently generates zero revenue during the midnight valley, converting a national liability into a productive economic asset.
Furthermore, this transition aligns with a fundamental structural shift in Pakistan’s generation mix away from expensive imported fuels (LNG and crude oil) and toward low-cost indigenous sources, as detailed below:
| Power Generation Segment | Source Type | Mix Share (%) | Active Status & Future Pipeline Capacity |
| Indigenous Clean Energy (53.1% of national mix total) | Hydropower | 31.40% | Baseline of 9.5 GW scaling to 19.5 GW by 2035 via Dasu, Tarbela 5th Ext, and Diamer Basha. |
| Nuclear Power | 18.10% | 3,530 MW active capacity; the upcoming Chashma C-5 project will add 1,200 MW by 2030. | |
| Grid-Scale Renewables | 3.60% | Wind, biomass, and solar arrays feeding directly into the national transmission grid. | |
| Thermal & Dispersed Energy (46.9% of national mix total) | Coal, Gas & Solar BTM | 46.49% | Driven heavily by 7,319 MW of solar net-metering; includes the 500 MW Keenjhar Lake floating solar project. |
| Furnace Oil (FO) | 0.41% | Phased out completely from active generation; local refineries now export 1.2 million tons of surplus FO annually. |
Transitioning the vehicle fleet to the grid means cars will run primarily on indigenous, low-cost electron generation rather than imported Middle Eastern oil.
8.4 The Solar-Hydro Nexus: Unlocking Distributed Generation (Continued)
Pakistan’s distributed solar revolution is actively reshaping the energy landscape. By March 2025, net-metered rooftop solar reached 6.8 GW, while off-grid and behind-the-meter (BTM) installations added an estimated 12 GW. Industry analysts suggest that industrial and commercial rooftops alone could host 20–25 GW of additional solar capacity, with the domestic sector contributing over 10 GW more. Cumulatively, Pakistan has imported over 51 GW of solar modules, with estimates of deployed capacity ranging from 27 GW to 33 GW.
However, most of this capacity currently operates behind-the-meter—serving on-site consumption without feeding into the national grid. Grid modernization—leveraging the ongoing USD 9 billion NTDC upgrade, smart RMUs, and Time-of-Use (ToU) metering—can unlock this distributed resource and integrate it into the national system.
The true transformative potential lies in pairing this distributed solar capacity with pumped hydro storage. Pakistan’s updated Indicative Generation Capacity Expansion Plan (IGCEP 2025–2035) envisages adding approximately 21,400 MW of hydropower capacity by 2035.
Ongoing hydel projects will double Pakistan’s hydel generation capacity from approximately 9,500 MW to 19,500 MW. By integrating floating solar PV on dam reservoirs with pumped hydro storage, Pakistan can create a virtual battery—using midday solar surplus to pump water uphill and releasing it to meet evening peak demand.
This solar-hydro nexus offers a sovereign pathway: the sun costs nothing, the water belongs to Pakistan, and the storage is indigenous.
Together, BTM solar and pumped hydro can stabilize the grid, reduce reliance on expensive thermal generation, and transform Pakistan’s energy system from import-dependent to self-reliant.
8.5 The Symbiotic Logic
This is where the structural pieces of the energy and transport ecosystems lock together into a single, cohesive matrix:
| Transition Element | Core Macroeconomic & Grid Contribution |
| Transport Electrification | Displaces petrol imports (targeting the $13.5B+ annual bill) to provide immediate CAD relief. |
| EV Charging Load | Draws power during nighttime valleys to absorb stranded off-peak grid capacity with no new generation required. |
| Hydel Expansion | Injects low-cost baseload power into the grid (e.g., Dasu Hydropower project: 12 billion kWh/year by 2027). |
| Nuclear Expansion | Anchors clean, weather-independent baseload capacity (e.g., Chashma C-5: 1,200 MW by 2030). |
| Floating Solar PV | Expands scalable renewable generation without land-use conflicts at a benchmark tariff of 3.98 cents/kWh. |
| BTM Solar Infrastructure | Capitalizes on 7,319 MW of active net-metering while unlocking an estimated 20–30 GW of untapped rooftop capacity. |
| Thermal Power Retirement | Systematically phases out expensive, imported furnace oil (FO) and high-speed diesel generation plants. |
The result: Pakistan’s transport sector shifts from imported oil to domestically generated electricity. That electricity comes increasingly from hydel, nuclear, and solar—sources that cost nothing to fuel, pollute nothing, and belong to no foreign power.
The foreign exchange saved from reduced oil imports can be deployed toward industrial development, debt servicing, and social programs. The stranded capacity payments that currently bleed the power sector are transformed into productive assets that serve the national fleet.
And when the diesel-dependent HTV fleet and the railway network are eventually electrified, Pakistan’s dependence on imported fuels will shrink to negligible levels—delivering the final, decisive blow to the energy trap that has constrained the nation for decades.
This is not merely an energy transition. It is a sovereignty transition—from dependence on imported fuels to self-reliance on Pakistan’s own water, sun, and nuclear capability.
9. Infrastructure, Investor ROI, and Implementation Roadmap
The physical infrastructure required to support the swap network is substantial but achievable, leveraging the ongoing USD 9 billion NTDC grid upgrade and targeted DISCO distribution upgrades (smart RMUs, tap-changing transformers, phase balancing) costing an estimated PKR 75–95 billion nationwide.
These costs are fully covered by the levy revenue within the first two years. (The phased rollout of swapping stations is outlined in Appendix Table 10).
To attract private capital into the Battery-as-a-Service (BaaS) asset pool without requiring direct government deployment, the project-level yields are structured to outperform traditional infrastructure benchmarks:
| Infrastructure Asset Class | Target Project-Level Yield (IRR / Return Profile) | Financial Payback Horizon |
| BaaS Battery Asset Pool | 18% – 23% IRR | ~2.2 Years |
| Swapping Station Operation | 18% – 23% IRR | ~3.7 Years |
| CPEC Power Plants (Reference) | 17.0% – 18.4% IRR | Varies by fuel type |
| Oil & Gas Pipelines (Reference) | 14.6% IRR | Long-term concession |
| Floating Solar Arrays (Reference) | 13.9% IRR | Medium-term utility |
Note: At scale; with over 12 million two-wheeler batteries and half a million three-wheeler batteries deployed by 2035, the annual investor profit pool is projected to exceed PKR 580 billion. (The complete framework of tax holidays, duty-free imports conditional on local assembly, nominal land access, viability gap funding, utilization guarantees for pilot stations, and the PKR 5 per swap recycling fund is summarized in Appendix Table 12).
10. Policy and Regulatory Framework
Battery swapping sits at the intersection of energy regulation, industrial standards, and transport policy. Institutional mandates are divided across federal and provincial entities to ensure standard compliance and seamless revenue administration:
| Executing Agency / Authority | Primary Regulatory Responsibility & Enforcement Mandate |
| PSQCA (Pakistan Standards & Quality Control Authority) | Establishes the unified national battery physical, safety, and electrical standard. |
| NEPRA (National Electric Power Regulatory Authority) | Enforces dedicated EV charging tariffs and Time-of-Use (ToU) off-peak pricing brackets. |
| Ministry of Industries & Production | Directs inter-ministerial coordination and local CKD assembly industrial licensing. |
| FBR (Federal Board of Revenue) | Coordinates cross-border tax structures and national EV/electricity levy collections. |
| Provincial Governments | Administers local BaaS business registrations and executes the eventual ICE vehicle sales ban. |
10.1 The Regulatory Roadmap Deadlines
To provide private investors with a predictable policy horizon, the regulatory framework establishes strict implementation deadlines across the transition period:
Expected Outcomes – The Sovereign Dividend
When the road to the inn is paved, the innkeeper sees the results in his ledger. Likewise, this integrated blueprint produces measurable, interlocking gains across the national economy:
| Target Timeline | Regulatory Milestone | Core Action & Enforcement Mandate |
| Q1 2027 | National Battery Standard | PSOCA finalizes physical, dimensional, safety, and electrical parameters for smart swapping packs. |
| July 2027 | EV Charging Levy Activation | FBR and NEPRA officially implement the PKR 10/kWh development levy across all public/private charging networks. |
| December 2028 | Mandatory Swap Compatibility | Deadline for all 2W and 3W local OEMs to comply with standardized battery dimensions and connector protocols. |
| January 2029 | Full New ICE Vehicle Sales Ban | Provincial governments halt the registration of new petrol-powered 2W, 3W, and equivalent small passenger vehicles. |
- Energy Security: Systematic reduction of the $13.5 billion annual petroleum import bill via clean domestic electricity substitution. Future electrification of diesel-dependent HTVs and the railway network will eventually reduce remaining transport-related import reliance to negligible levels.
- Fiscal Sustainability: Secures a net fiscal surplus for the state every year from 2026 through 2034 (accumulating over PKR 1.6 trillion), bringing the 2035 fiscal position to a manageable structural breakeven well within the scope of parallel tax reforms.
- Household Prosperity: Two- and three-wheeler commercial riders save thousands of rupees per month from day one. Small car owners achieve maximized savings when vehicle charging is paired directly with home solar systems, granting all tiers of consumers long-term immunity from international oil price volatility.
- Grid Stability: Generates up to 8.5 billion kWh of predictable off-peak grid draw, absorbing stranded capacity and channelling vital liquidity into DISCOs to directly reduce the national power sector circular debt.
- Investor Confidence: A competitive 18% to 23% project IRR successfully attracts domestic corporate capital and diaspora remittances, building a high-tech, self-sustaining industrial manufacturing ecosystem inside Pakistan.
- Environmental Dividend: Drives down absolute urban emissions from the transport sector while establishing a clear decarbonization path for HTVs—which currently act as the primary contributors to hazardous vehicular smoke and particulate matter emissions.
Building the Road – Conclusion
Part I left the innkeeper with a diagnosis. Part II gave him a wiring diagram. This paper has drawn the road map – a practical, investible, and fiscally self-financing pathway that will allow the millions of riders who form Pakistan’s economic bloodstream to travel to the inn affordably, reliably, and without a single liter of imported petrol.
The mandatory two-year cutoff, the BaaS model that makes two- and three-wheelers cheaper upfront, the maintenance savings that add thousands of rupees to household budgets, the midnight valley that absorbs idle grid capacity, and the simple PKR 10/kWh levy that delivers fiscal surplus for nearly a decade – together, they form a coherent, executable national strategy.
Crucially, the numbers hold even at the lowest expected petrol price floor (PKR 225/L). If prices rise to PKR 250/L – or higher – the consumer savings and fiscal surplus grow exponentially. This is a no-regret policy.
The path forward is clear. The two- and three-wheeler revolution is the first decisive step. The passenger car transition follows. And then – when the technology and economics mature – the diesel-dependent HTV fleet, the railway network, and the remaining urban bus fleet will make their transition. At that point, Pakistan’s dependence on imported fuels will shrink to negligible levels. The innkeeper can finally count his guests. The arithmetic that started with a quiet tragedy in the hills can end with a full house, a solvent ledger, and a sovereign nation.
Part IV will turn from the road to the engine room: Floating Solar, Pumped Hydro Storage & the WEFE Nexus – how Pakistan’s dams, crowned with solar panels, will power this new demand with fuel that costs nothing, pollutes nothing, and belongs to no foreign power. The rooms are wired. The road is being paved. The energy to light the inn and carry its guests will come next – from the sun on the water and the weight of water in the mountains.
Appendix – Detailed Tables and Calculations
All assumptions, formulae, and detailed numerical results are presented below. The main body references these tables.
| Product | Volume | Landed cost (USD/bbl) | Annual bill (USD billion) |
| Petrol (MS) | 44 million barrels | $ 110.00 | $ 4.84 |
| Diesel (HSD) | 28 million barrels | $ 110.00 | $ 3.08 |
| Total | $ 7.92 |
| Vehicle | Petrol equivalent (new) | EV chassis (BaaS) | Difference |
| 2-wheeler (scooter) | 165,000 | 90,000-160,000 | -5,000 to -75,000 |
| 3-wheeler (rickshaw) | 450,000 | 180,000-260,000 | -190,000 to -270,000 |
| Small hatchback (660cc equivalent) | 2,250,000 | 2,875,000 | 625,000 |
| Year | 2-Wheelers | 3-Wheelers | Cars / SUVs |
| 2024 | 2.00% | 0.50% | 0.20% |
| 2025 | 4.00% | 2.00% | 0.50% |
| 2026 | 7.00% | 5.00% | 1.00% |
| 2027 | 12.00% | 12.00% | 2.00% |
| 2028 | 20.00% | 25.00% | 4.00% |
| 2029 | 35.00% | 45.00% | 8.00% |
| 2030 | 48.00% | 62.00% | 14.00% |
| 2031 | 58.00% | 75.00% | 22.00% |
| 2032 | 66.00% | 84.00% | 32.00% |
| 2033 | 72.00% | 90.00% | 42.00% |
| 2034 | 76.00% | 94.00% | 50.00% |
| 2035 | 80.00% | 97.00% | 56.00% |
| 2036 | 84.00% | 99.00% | 60.00% |
Note: Projections assume mandatory ICE cutoff for new 2W/3W sales by December 2028 and for 4W by January 2032. Fleet turnover modeled using 10-year (2W), 8-year (3W), and 15-year (4W) average lifespans.
| Vehicle | Efficiency (km/kWh) | EV Cost/km (PKR) | Petrol Cost/km @ 225/L | Petrol Cost/km @ 250/L |
| 2-wheeler (55 km/L petrol) | 25 | 2 | 4.1 | 4.55 |
| 3-wheeler (28 km/L petrol) | 15 | 3.3 | 8 | 8.9 |
| Small EV Car (8.5 km/kWh) | 8.5 | 5.9 | 15 | 16.7 |
EV cost at PKR 50/kWh effective tariff (including PKR 10/kWh levy).
| Vehicle | Petrol maintenance | EV maintenance | Saving |
| 2-wheeler | 5,400 | 1,500 | 3,900 |
| 3-wheeler | 8,000 | 2,000 | 6,000 |
| Small hatchback | 16,500 | 1,500 | 15,000 |
| Vehicle | Monthly km | Petrol Total (225) | Petrol Total (250) | EV Total (BaaS) | Saving (225) | Saving (250) | Extra Upfront | Payback (225) | Payback (250) |
| 2W Private | 1,500 | 7,650 | 8,325 | 6,050 | 1,600 (21%) | 2,275 (27%) | -5k to – 75k | Instant | Instant |
| 2W Delivery | 2,500 | 12,250 | 13,375 | 8,250 | 4,000 (33%) | 5,125 (38%) | -5k to – 75k | Instant | Instant |
| 3W Taxi | 3,000 | 27,500 | 30,200 | 17,000 | 10,500 (38%) | 13,200 (44%) | -190k to – 270k | Instant | Instant |
| Small Car (Home) | 2,000 | 35,500 | 38,830 | 34,260 | 1,240 (3.5%) | 4,570 (12%) | 625,000 | ~42 yrs | ~11.4 yrs |
| Small Car + Solar | 2,000 | 35,500 | 38,830 | 22,500 | 13,000 (37%) | 16,330 (42%) | 1,625,000 | ~10.4 yrs | ~8.2 yrs |
Off-grid solar (3 kW + 10 kWh LFP, PKR 1,000,000) eliminates monthly energy cost (PKR 11,760). Solar payback = 4.5 years.
Table 7: Breakeven Petrol Price (2-wheeler, 1,500 km/month)
At breakeven, petrol cost per km = EV cost per km.
Calculation:
PKR 110/L – far below current PKR 225/L. EV remains cheaper even if petrol price drops dramatically.
| Year | Total station energy (Billion kWh) | Grid draw (Billion kWh) | Levy revenue (Billion PKR) | Grid savings (Billion PKR) |
| 2026 | 0.83 | 0.42 | 4.2 | 20 |
| 2027 | 1.56 | 0.78 | 7.8 | 37 |
| 2028 | 2.85 | 1.43 | 14.3 | 67.8 |
| 2029 | 5.17 | 2.59 | 25.9 | 122.8 |
| 2030 | 7.52 | 3.76 | 37.6 | 178.4 |
| 2031 | 9.81 | 4.91 | 49.1 | 232.9 |
| 2032 | 12.1 | 6.05 | 60.5 | 287 |
| 2033 | 14.15 | 7.08 | 70.8 | 335.8 |
| 2034 | 15.72 | 7.86 | 78.6 | 372.8 |
| 2035 | 16.95 | 8.48 | 84.8 | 402.2 |
Grid savings = avoided capacity payments @ PKR 47.4/kWh of off-peak grid draw.
| Year | Total fiscal benefit (levy + grid savings) | Gross PDL lost | Net fiscal position |
| 2026 | 24.2 | 4.9 | 19.3 |
| 2027 | 44.8 | 11.2 | 33.6 |
| 2028 | 82.1 | 20 | 62.1 |
| 2029 | 148.7 | 28.8 | 119.9 |
| 2030 | 216 | 39.8 | 176.2 |
| 2031 | 282 | 48.3 | 233.7 |
| 2032 | 347.5 | 56.6 | 290.9 |
| 2033 | 406.6 | 62.5 | 344.1 |
| 2034 | 451.4 | 68.9 | 382.5 |
| 2035 | 487 | 517.7 | −30.7 |
Note: The modest 2035 gap is well within the scope of parallel fiscal reforms. The government enjoys positive cash flow every year from 2026 through 2034, providing ample time to broaden the tax base and adjust the PDL rate as needed.
| Phase | Period | Cities/Corridors | Stations per corridor | Cumulative stations |
| Pilot | 2027-2028 | Lahore, Karachi, Isb-Rwp | 50-150 | 300 |
| Scale-up I | 2029-2030 | All cities >1M population | 1 per 10,000 e-bikes | ~1,000 |
| Scale-up II | 2031-2035 | Motorways + national highways | 1 per 50 km | ~2,500 |
| Metric | Value |
| Battery investment | PKR 40,000 |
| Monthly BaaS subscription | PKR 2,350 |
| Per-swap margin to investor | PKR 40 |
| No of Swaps per day per battery | 1 |
| Annual subscription revenue | 28,200 |
| Annual swap margin revenue | 14,600 |
| Total annual revenue | 42,800 |
| Operating costs (monitoring, insurance) | 1,500 |
| Net annual profit (per battery) | 41,300 |
| Gross ROI (pre-overhead) | 103% |
| Project-level IRR (full network) | 18-23% |
| Payback period (investor) | ~2.2 years |
| Incentive | Detail |
| Tax holiday | 3-year corporate tax exemption; next 3 years 50% of standard rate |
| Duty-free imports | Zero customs on batteries, BMS, chargers for 5 years (with local assembly conditions) |
| Land access | PKR 10,000/acre/year on govt sites; 5-year rent-free period |
| Viability gap | Up to 10% of capex for stations meeting solar integration targets |
| Utilization guarantee | Govt backs minimum 1,000 swaps/day for first 12 months (limited to pilot stations) |
| Recycling surcharge | PKR 5 per swap – funds battery second-life and recycling |
| Milestone | Responsible body | Target date |
| Issuance of national battery standard | PSQCA | Q1 2027 |
| EV Infrastructure tariff class & ToU rates; PKR 10/kWh levy notification | NEPRA / FBR | Q2 2027 |
| Mandatory swap-compatibility for new registrations | Ministry of Industries | Dec-28 |
| Ban on new ICE passenger vehicle sales | Cabinet (via ordinance) | Jan-29 |
| Implementation of PKR 10/kWh charging levy | FBR | Jul-27 |
| Period | Import Volume (MMT) | Import Bill (USD billion) |
| July-March FY2025-26 | 13.88 | 8.9 |
| 10 Months FY2025-26 | ~14.0 | 13.5 |
| Annual Estimate | ~18-19 MMT | ~18-20 |
| Metric | Value |
| Daily diesel consumption | ~350,000 liters |
| Monthly diesel consumption | ~10.5 million liters |
| Annual diesel consumption | ~127.75 million liters |
| Daily fuel cost | Rs 109.01 million |
| Monthly fuel cost | Rs 3.27 billion |
| Project | Details |
| Punjab Electric Buses | 400+ operational; 700 more to be added |
| Punjab Budget 2026-27 | Rs 143 billion for mass transit; 2,000 electric buses |
| Karachi BRT Yellow Line | 256 electric buses (World Bank-funded) |
| KP Hazara Electric Bus | Rs 10 billion approved |
| Islamabad Electric Buses | Operating on 21 routes; 20 more routes planned |
| Multan Electric Buses | 45 buses in first phase; 24 more in second |
References
- Ministry of Industries and Production – National Electric Vehicle Policy 2025-30
- Pakistan State Oil (PSO) – Finished fuel import data, FY2025-26
- National Transmission & Despatch Company (NTDC) – Grid evacuation and capacity payment reports
- Federal Board of Revenue (FBR) – Petroleum levy data (FY27 budget)
- World Bank – Boosting Energy Security through Transmission in Pakistan (BEST-PAK) Program
- Asian Development Bank – Second Power Transmission Strengthening Project
- International Energy Agency – Global EV Outlook 2025
- Pakistan Standards and Quality Control Authority – Draft battery interchangeability standard
- Pakistan Bureau of Statistics – Petroleum import data, FY2025-26
- Oil Companies Advisory Council (OCAC) – Petroleum consumption data, FY2025-26
- Pakistan Railways – Diesel consumption and cost data
- Associated Press of Pakistan – Electric bus rollout data
Disclaimer:
All prices, tariffs, and fiscal projections are as of June 2026 and based on the post-peace deal baseline of USD 79-80/bbl crude and FY2026-27 budget incentives. The dual-price analysis (PKR 225/L and PKR 250/L) is provided to illustrate the robustness of the policy under different oil price scenarios. Readers should consult current official sources before making investment decisions.